
How Accurate Is Your Smartphone Gps
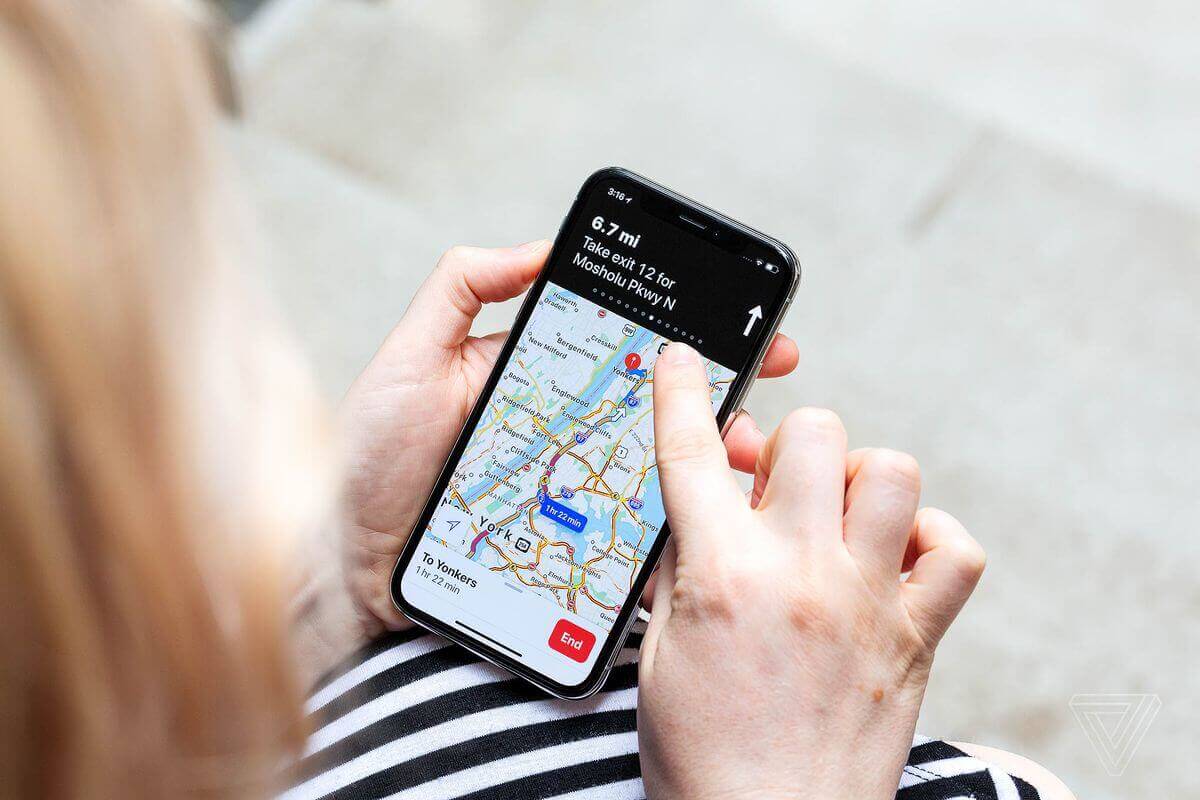
How Accurate Is Your Smartphone Gps Published on Dec 9, 2015 As part of Officer Assist, our Android based guard tour system, we track the movement of security guards using the phones GPS location. We have collected hundred’s of millions of individual fixes and so we thought it would be interesting to try and find the accuracy of each fix and of phone based GPS in general. What we found may surprise you!
Getting the Raw Data
Fortunately for us, the Location API in Android gives us an accuracy figure for each position (see http://developer.android.com/reference/android/location/Location.htm). Interpreting this value is a little tricky as it represents a 68% confidence that the point is within a certain number of meters. This is generally what we think of as one standard deviation if we assumed that location errors are random within a normal distribution. The documentation does however warn us that in practice that may not always be the case. Importantly though, it does give us a standard way to understand fix accuracy.
Another factor is that the location services do not only use GPS when you have them in High Accuracy mode but will also try to get a location with cell tower and wifi connections. We decided not to be concerned with exactly how the phone finds its position but rather with how accurate that position is. For more detail on exactly how this works, we suggest you look at http://developer.android.com/guide/topics/location/strategies.html.
Different phones also have different GPS receivers and this will probably lead to different accuracies. We decided that we had sufficient coverage of different phones and so we would just consider the average as this was more interesting in a real world sense to our use anyway.
Methodology
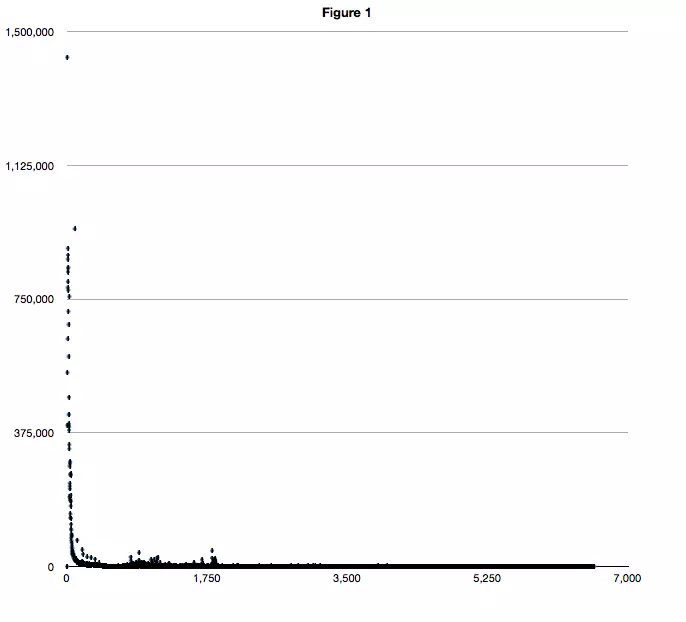
We decided to look at a random population of 30 million fixes and see what we could find. Initially, we did a scatter plot of the whole dataset with count vs accuracy. This is shown as figure 1. We can see from this that there tends to be a lot of fairly accurate positions with the count very high and the count drops off quickly to an accuracy of around 150. After that it continues to decline but gets as high as 6580.
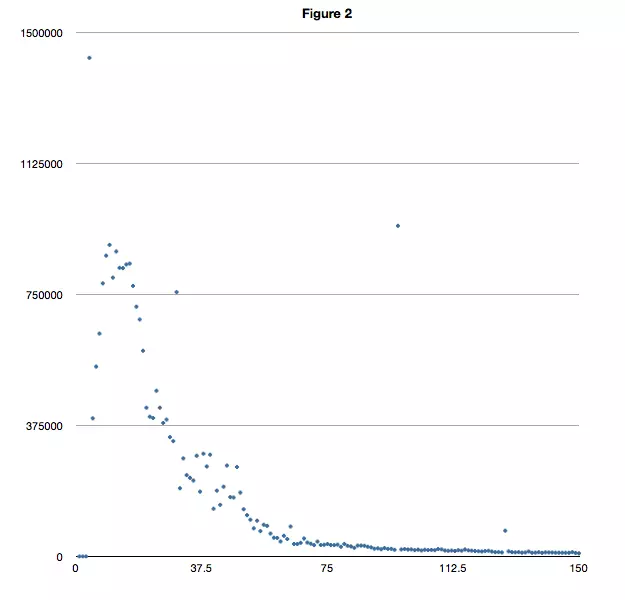
To get a more detailed view of the most critical part of the curve, we plotted only those values below 150. This is shown in figure 2. By far the most entries are for a quality of 4 which, at 1.4 million is close to double the next value down. There are under 10 with values less that 4 so I assume this is the most accurate our phone can get. There are a few strange outliers such as 96. In order to to try confirm is this was just a strange artifact of the data we have chosen, we did a second run of 30 million fixes and it gave very similar results. For some reason 96 is a large value in both datasets. We considered this might be the value at which cell tower triangulation occurs but most evidence on the internet leads us believe that would be a much bigger number. The high number of 96’s remains a mystery.
Outdoor vs Indoor
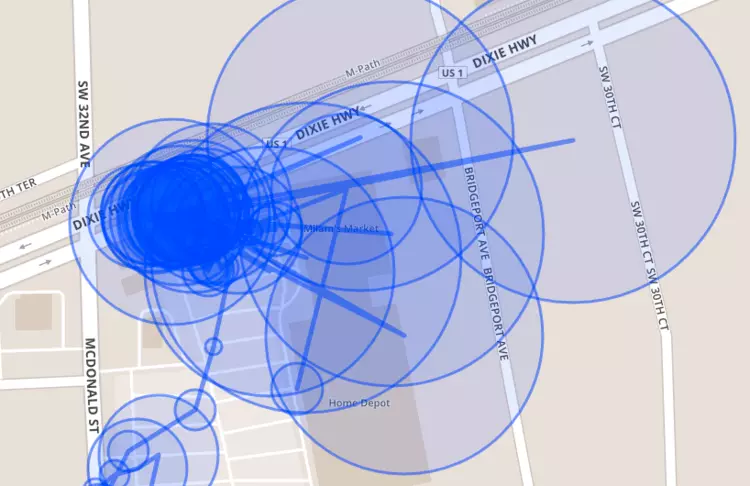
Unfortunately we have no absolute way of telling if a fix was taken when a device was indoors vs outdoors. We were however pretty certain that indoor readings would be far worse as the cannot use the GPS. To get some anecdotal evidence for this, we plotted a track of driving to a local supermarket and walking around.
On the map, we plotted a circle each time we had a fix. The radius of the circle is the accuracy in meters as reported by the phone. You can clearly see that the is a group of larger circles at the end of the track. That was at the supermarket and hence indoor fixes.
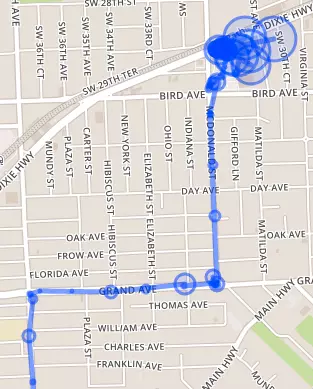
To further understand this, we blew up that area and it seems we have a cluster around the approximate place where the car was parked, which could be the last actual GPS fix. In any case, it is clear that accuracy indoors is far poorer than outdoors.
Conclusion
In reality, we are really interested in how accurate fixes are in general so some data smoothing seemed like a good idea. From figure 3, you can see a percentage breakdown by 10 meter range of fix accuracies.
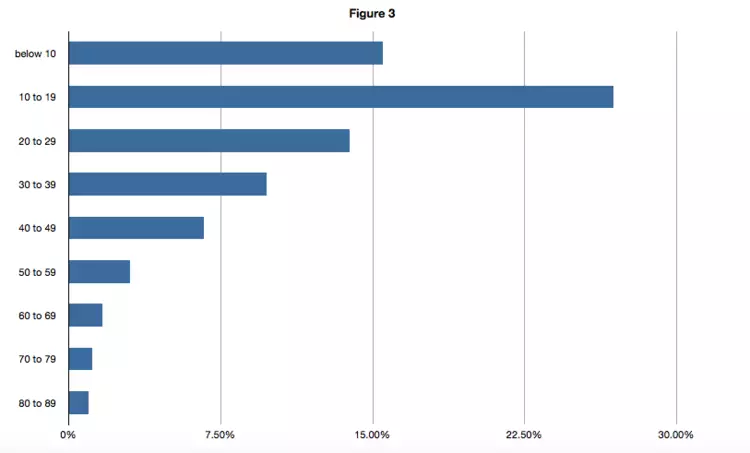
Ultimately, it seems around 40% are more accurate than 20 meters and 60% more accurate than 50 meters. For us, that gives a sufficient understanding of what to expect in most cases. Remember, this is just statistics on raw data. This tells us what the phone is reporting on each individual fix. For practical purposes, these fixes are post processed to give accurate tracks.

New Kugadi Posts

Efficiently Manage Your Security Guard Team Remotely
The hidden challenges of remotely managing operations and why smart automated security technology is so important in mitigating risks.

Why automation is critical for your security department
By using a data-driven approach, companies have a holistic view of how areas perform and can find repeat problem areas to take action. They can better understand if more lighting is needed, extra guards, etc.

How Data Illuminates Safety Concerns
Looking at the data you collect greatly helps you run your security guard company